DescribeDisplay is an R package that provides a way to recreate ggobi graphics in R. The R package takes the R scripts describing the ggobi plots produced by the plugin and reproduces the plots in R. These can be saved as pdf or some other format for inclusion in papers. Most of the figures in the upcoming book on R and ggobi were produced this way.
Installation
From R, run:
install.packages("DescribeDisplay", dep=TRUE)
Getting started
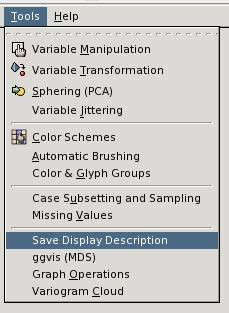
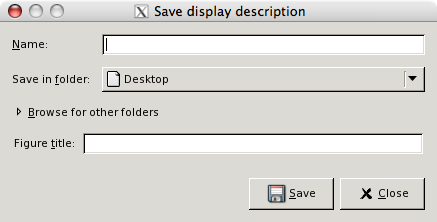
To save a plot from GGobi, click on Describe Display in the tools menu. If you can't see this menu, then you do not have the DescribeDisplay plugin installed. Please contact the GGobi mailing list for more help.


- Then, in R, use
dd_loadto load the file into a R object:library(DescribeDisplay) pd <- dd_load("~/desktop/my-plot.r") - See
?plot.ddand?ggplot.ddfor producing graphics.plot(pd) ggplot(pd)