Introduction
This page describes the use of parallel coordinate plots to explore
multivariate data. The data we will use contains eight continuous variables measuring percentage fatty acid composition in olive oil samples, and two categorical variables describing where in Italy they come from. You can find this data set in your GGobi data directory, olive.xml
To open a parallel coordinate plot, choose the Display menu, and select New Parallel Coordinates Display.
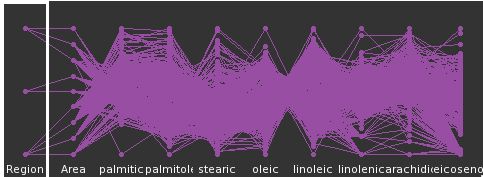
There are ten variables in this data, and hence ten vertical parallel axes. The first two variables are categorical. The latter eight are continuous variables.
We don't need the variable Area for this demonstration so we will remove it from the display.
In this movie we show what happens when you click the check box next to the variable you want to remove.
Reordering
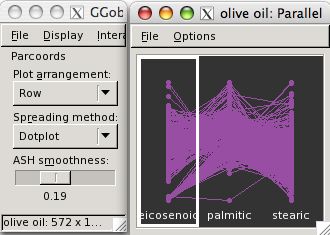
We can change the order of the variables in the parallel coordinate plot by dragging and dropping. To do this, make sure the plot you want to move has focus (indicated by the thick white line around the plot), and then drag and drop it to its new position
Brushing
Suppose we would like to examine the fatty acid values for region one. We go into brush mode, and make sure the focus in the parallel coordinate plots is on the first variable. In this movie we move the brush over the points corresponding to region one to highlight the cases of interest.
Region one has relatively high values of eicosenoic, arachidic and linolenic acids, but the full ranges of values on all other variables. Similarly, we could explore the values for the other regions.
Investigating an outlier
One thing that is noticeable in the parallel coordinate plot is that there is an outlier in palmitic acid. To examine this case, we change the focus of the plots to be palmitic acid, and then brush this point.
This case is also an outlier on oleic acid but otherwise not particularly unusual.
Options
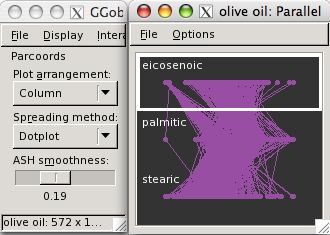
There are numerous controls for the parallel coordinate plot. The plot arrangement, allows the parallel axes to be laid out vertically instead of horizontally.
The spreading method sets the way the points are plotted: the default is a dotplot, alternatives are textured doptplots or ASH plots.
For these latter methods, the lines might not make as much sense as for the plain dotplot. We turn these off by using the Options menu on the plot window.